
Investing in the stock market isn’t just about picking random stocks and hoping they grow. Successful investors rely on fundamental analysis, which helps them evaluate a company’s financial health and long-term potential. If you’re new to investing, understanding these key terms will help you make informed decisions.

1. Understanding Financial Statements
Financial statements provide a snapshot of a company’s financial performance and stability. The three main financial statements are:
- Balance Sheet – Displays a company’s assets, liabilities, and shareholders’ equity at a given point in time.
- Income Statement – Shows the company’s revenue, expenses, and net profit over a period.
- Cash Flow Statement – Tracks cash inflows and outflows, helping assess liquidity and solvency.
2. Key Financial Metrics
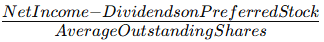
- Earnings Per Share (EPS) – Indicates how much profit a company earns per share. A higher EPS is generally positive. Formula:
- Price-to-Earnings Ratio (P/E Ratio) – Measures how much investors are willing to pay for each dollar of earnings. A lower P/E suggests a stock might be undervalued.Formula:

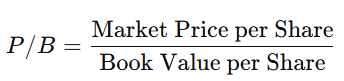
- Price-to-Book Ratio (P/B Ratio) – Compares a company’s market value to its book value. A lower P/B could indicate an undervalued stock. Formula:
- Dividend Yield – Measures how much a company pays in dividends relative to its stock price, useful for income-seeking investors. Formula:

3. Profitability Ratios
These ratios help investors understand how efficiently a company generates profits.
- Gross Profit Margin – Shows the percentage of revenue remaining after covering production costs. Formula:

- Operating Margin – Reflects how much profit remains after covering operating expenses. Formula:

- Net Profit Margin – The final profitability measure after deducting all expenses, including taxes. Formula:

4. Liquidity & Solvency Ratios
These ratios determine whether a company can meet its short-term and long-term financial obligations.
- Current Ratio – Measures a company’s ability to pay short-term liabilities with short-term assets. Formula:

- Quick Ratio (Acid-Test Ratio) – A stricter measure of liquidity, excluding inventory. Formula:

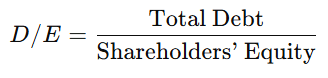
- Debt-to-Equity Ratio (D/E Ratio) – Shows how much debt a company has compared to shareholders’ equity. Formula:
5. Other Fundamental Indicators
Additional key indicators used in fundamental analysis include:
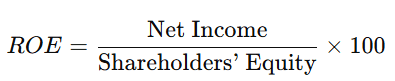
- Return on Equity (ROE) – Measures how effectively a company generates profit from shareholders’ equity. Formula:
- Return on Assets (ROA) – Shows how efficiently a company uses its assets to generate profit. Formula:

- Free Cash Flow (FCF) – Represents cash available after capital expenditures, indicating financial flexibility. Formula:

6. Valuation Models for Stock Analysis
Understanding these fundamental analysis terms is essential for making informed investment decisions. By evaluating financial statements, profitability ratios, and valuation metrics, you can determine whether a stock is worth investing in. The more you analyze, the better your chances of picking solid, long-term investments!
Two common valuation methods help determine a stock’s fair price:
- Discounted Cash Flow (DCF) – Estimates a company’s value based on its projected future cash flows.
- Dividend Discount Model (DDM) – Values a stock based on expected future dividend payments.
Final Thoughts
Understanding these fundamental analysis terms is essential for making informed investment decisions. By evaluating financial statements, profitability ratios, and valuation metrics, you can determine whether a stock is worth investing in. The more you analyze, the better your chances of picking solid, long-term investments!
Are you using fundamental analysis for your investments? Let us know in the comments!
Leave a Reply